

Regulated Catalyzing System (RCS)
What is it
This model, taken from a biology domain, is a fairly simple Xholon application. A regulated catalyzing system (RCS) contains catalysts as well as entities that regulate the catalysts. The Glycogen Phosphorylase System is one such system, in which Glycogen Phosphorylase is the catalyst, and Phosphorylase Kinase and Phosphorylase Phosphatase regulate its activity. Examine the diagram as you read the following text.
A Glycogen Chain is glucose that is stored in long chains. When you eat, other molecular machinery (not shown in this model) combines molecules of glucose (sugar) found in your food, into these chains of glycogen for storage.
Glucose-1-phosphate is a form of glucose that can be readily used by the body for energy.
Glycogen Phosphorylase can be either active or inactive. It becomes active when a phosphoryl group is added to it (called phosphorylation), and inactive when the phosphoryl group is removed (called dephosphorylation). When active, it breaks down long glycogen chains into glucose-1-phosphate.
Phosphorylase Kinase is a regulating catalyst that can activate Glycogen Phosphorylase by phosphorylating it.
Phosphorylase Phosphatase is a regulating catalyst that can deactivate Glycogen Phosphorylase by dephosphorylating it.
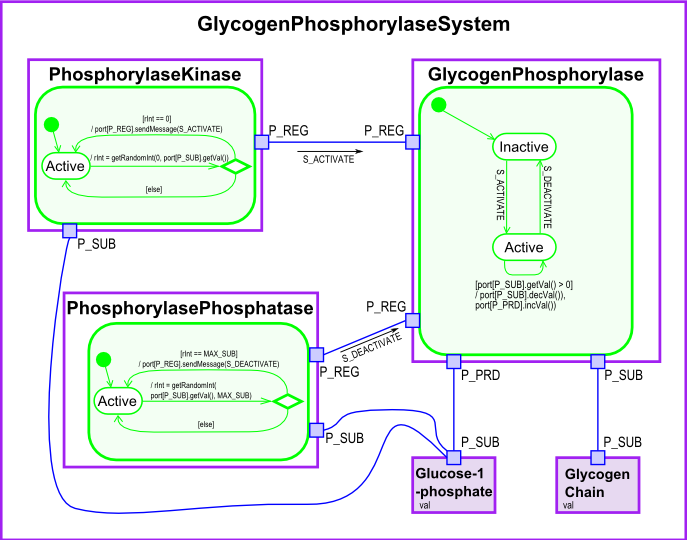
The Xholon model contains all of the entities shown on the above diagram. Look at the XML configuration files in Xholon/config/Rcs.
Rcs1_InheritanceHierarchy.xml shows that GlycogenPhosphorylase is a subclass of RegulatedCatalyst which in turn is a subclass of Catalyst. Similarly, GlycogenPhosphorylaseSystem is a RegulatedCatalyzingSystem which is a CatalyzingSystem. Examine Rcs1_InheritanceHierarchy.xml to see the rest of the inheritance structure.
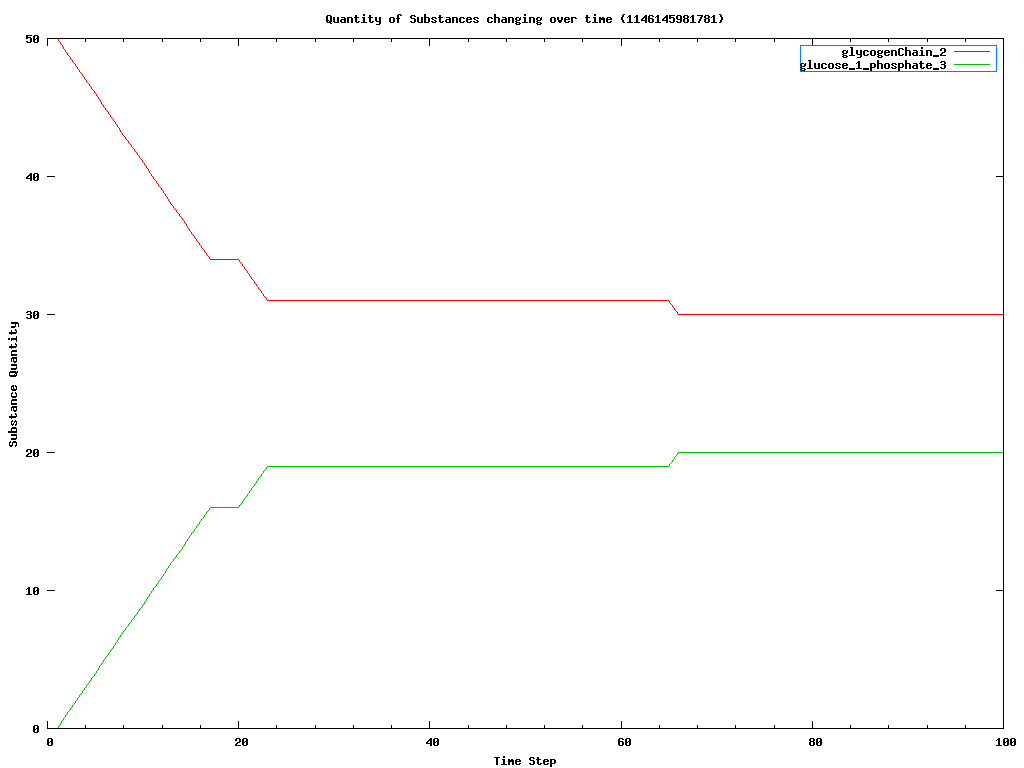
Rcs1_CompositeStructureHierarchy.xml specifies the composite structure shown in the above diagram. GlycogenPhosphorylaseSystem has five children. GlycogenChain initially has a length of 50 (name="val" value="50"), while initially there are 0 Glucose_1_phosphate molecules (name="val" value="0").
Rcs1_ClassDetails.xml specifies the port connections between xholons. Note that it uses the superclass names rather than the specific molecule names. For example, it uses the class name Regulator, and therefore applies to both PhosphorylaseKinase and PhosphorylasePhosphatase. P_SUB, P_PRD and P_REG are the port names used in XhRcs1.java. Catalysts and Regulators are active objects (XhtypePureActiveObject), while Substances are passive objects (XhtypePurePassiveObject). Active objects act on passive objects.
Now look at the Java class files in Xholon/src/org.primordion.xholon.tutorials.rcs .
XhRcs1.java includes most of the rest of the detail shown on the above diagram. S_ACTIVATE and S_DEACTIVATE are the names of signals sent in messages from Regulators to Catalyst. STATE_INACTIVE and STATE_ACTIVE are the names of the inactive and active states of the Regulators and Catalyst.
In the act() function, when GlycogenPhosphorylase is in STATE_ACTIVE, it decrements the amount of substrate (GlycogenChain), and increments the amount of product (Glucose-1-phosphate).
PhosphorylaseKinase randomly sends an activate message when the amount of Glucose-1-phosphate gets too low. PhosphorylasePhosphatase likewise randomly sends deactivate messages.
In the processReceivedMessage() function, the Catalyst (GlycogenPhosphorylase) deterministically changes state when it receives either a S_ACTIVATE or S_DEACTIVATE message from one of its regulators.
How to use it
Run it:
- Run the Java application through the Xhn GUI (org.primordion.xholon.app.Xhn.java), and select File --> Open --> Rcs --> Rcs1_xhn.xml.
- Expand the Controller node in the tree.
- Press the Start node.
- You should see a chart open up in a separate window, if you have JFreeChart installed. If you don't have JFreeChart installed, change the UseDataPlotter value to "gnuplot" in the Rcs1_xhn.xml file. The results will be saved to a .cvs file in the statistics directory. You can look at this text file directly, or if you have gnuplot on your system, you can run the .plt file to convert the .cvs file into a displayable .png file. Many other software products can also read .cvs files. The following chart is a typical one produced by gnuplot for the RCS application.
Things to notice
Rcs1_ClassDetails.xml could be reused as is in similar systems, because it only uses superclass names.
Note the use of xpath expressions in Rcs1_ClassDetails.xml, for example:
connector="#xpointer(ancestor::CatalyzingSystem/Substrate)"
Things to try
Set UseInteractions to "true" in Rcs1_xhn.xml. Look at the generated seq<TIMESTAMP>.pic file in the interaction folder.
If you have the JUNG software package installed, set UseGraphicalTreeViewer and UseGraphicalNetworkViewer to "true" in Rcs1_xhn.xml. Examine the generated tree and network diagrams.
Extending the model
This is just a small part of a larger biochemical system.
Xholon features
How to use abstract superclass names to locate port targets.
How to generate JFreeChart and gnuplot charts, and .cvs data files.
Credits and references
Google for "Glycogen Phosphorylase", both regular web pages and Images.