

Digital Watch - Sample Xholon App
What is it
The Digital Watch sample application simulates the internal structure and behavior of a fairly generic digital watch I own. It has four buttons which can be labeled S1, S2, S3 and S4. It displays the time or the date. By pressing the four buttons in various combinations, the current second, minute, hour, month, day and date can be updated, and various other internal functions can be managed.

The Xholon classes, and the inheritance relationships between these classes, are shown in the following UML diagram.

How to use it
Run it:
- Run the Java application through the Xhn GUI (org.primordion.xholon.app.Xhn.java), and select File --> Open --> Watch --> Watch_Poseidon_xhn.xml.
- Expand the Controller node in the tree.
- Press the Start node.
- You should see a bunch of messages like those shown below:
Regular:state_13 activeSubState is Time:state_24
Displays:state_11 activeSubState is Regular:state_13
Top:state_7 activeSubState is Displays:state_11
stateMachine_5 activeSubState is Top:state_7
View the nested composite structure using the JTree default viewer. As you can see in the following diagram, WatchUserSystem contains two parts: acmeWatch_1 (of XholonClass AcmeWatch) and user_183 (of XholonClass User). AcmeWatch in turn contains three parts: gui_2, timeDate_181, and tickGenerator_182. The nesting of composite structure continues several more levels within the instance of Gui (gui_2). Compare this view with the model specified in the CompositeStructure.xml file.
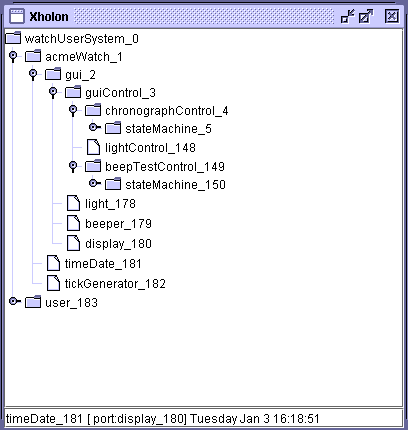
Click on timeDate_181. The bottom line of the viewer shows that this Xholon has one port that connects it to display_180. TimeDate's responsibility is to continuously update the current value of second, minute, month, etc. and regularly, by sending asynchronous messages through its port, tell Display what new values to present to the user. In the simulation Display currently does nothing, but if you click on the TimeDate instance, it will show the current time and date values, as in the above diagram. Simulation time proceeds faster than real time, so every time you press timeDate_181 at least some seconds will have gone by.
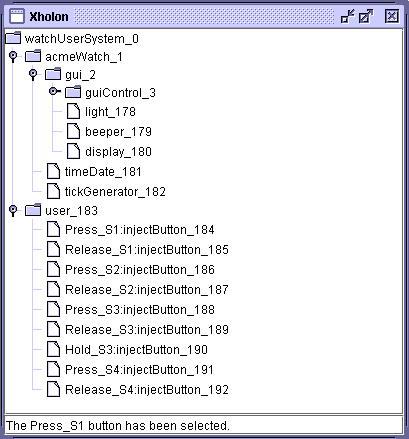
To update the time or date, click on the instance of User (user_183). You can now click on any of these nine buttons, to simulate pressing, releasing and holding the four buttons on the watch. Each selected action sends an asynchronous message to the gui_2 Xholon, which then forwards the message to the appropriate state machine. As you select button actions, various messages will display in the console window showing what's happening within the various hierarchical state machines. Press and release S1 to toggle between displaying the date, and displaying the time. Press and release S4 to watch the light go on and off. To update the month, select in this order:
- Hold_S3
- Press_S3
- Press_S1
- Press_S1
- Press_S1
- Press_S2
- Press_S2
- Press_S2
Now select timeDate_181 again. The month should now be April, because pressing S2 three times should have advanced the month from January to April. Now select Press_S3 to exit the update function, and go back to normal display of time.
Things to notice
The next diagram shows the complete state machine for the ChronographControl Xholon. This diagram was drawn using the free community edition of the UML modeling tool Poseidon 3.2, was saved as an XMI file, and was transformed using XSL into the various files required by the Xholon runtime framework. These are the four XML and text files in the config\Watch directory that have _Pos as part of their name, and DoActivity.txt. Follow the transitions on the state diagram to figure out which buttons you should select. All the press, release and hold actions describe above can be seen on the state diagram. On the diagram, s1 is the name of a transition, while S1/doActivity() means that S1 is a UML signal/event/trigger that triggers the doActivity() action. The diagram also shows the names of the states that are printed out in the console window while the simulation is running. The console also prints the state nesting, and the currently active state at each level in the hierarchy.
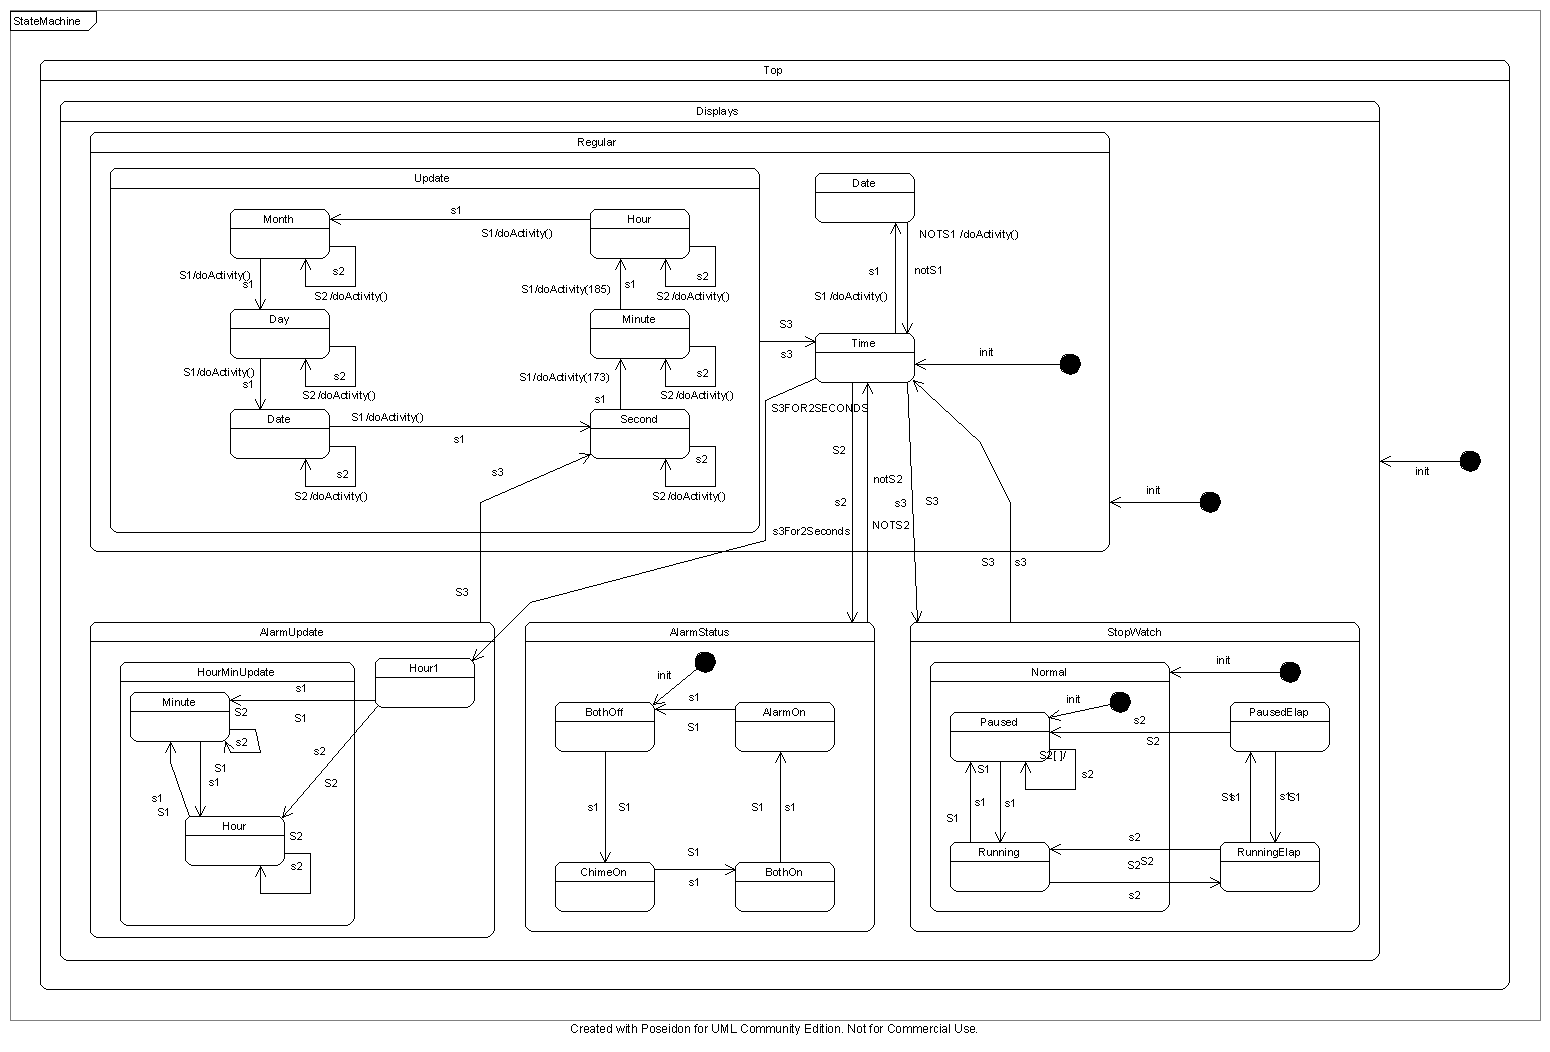
BeepTestControl has its own state machine, shown below, and also created as part of the same Poseidon model. It processes S1 and S2 press and release actions in parallel with the ChronographControl state machine.

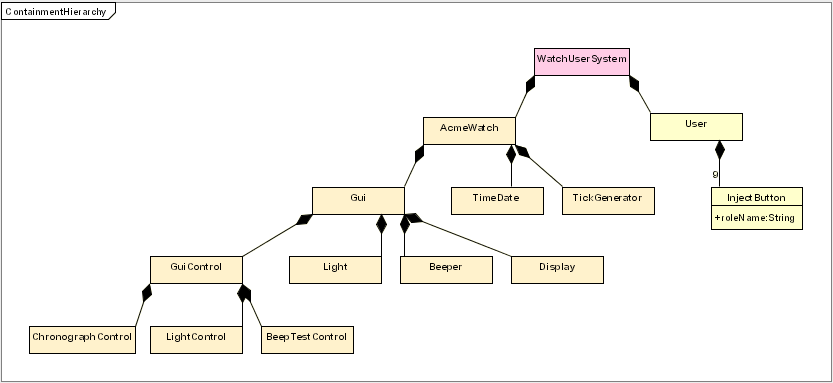
The composite structure of the model is defined in the following UML diagrams. The first is a class diagram showing containment relationships.
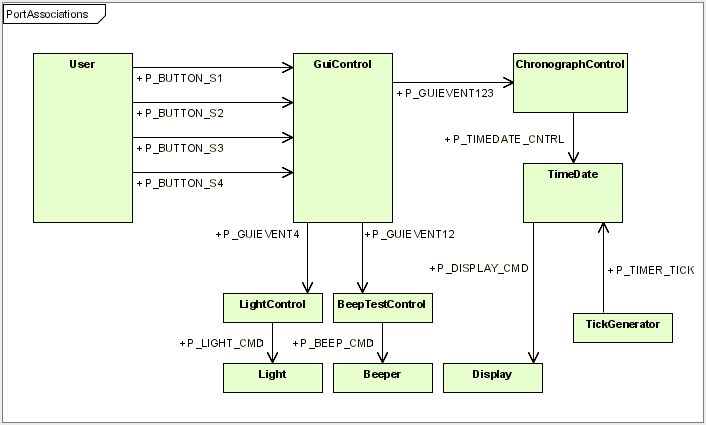
The next diagram is used to specify associations between Xholons, and gives the names of the ports that will help realize those associations at runtime. Poseidon (version 3.2) does not yet support the UML2 composite structure diagram, so parts and ports are modeled using associations. The XSL transforms these into Xholon ports.
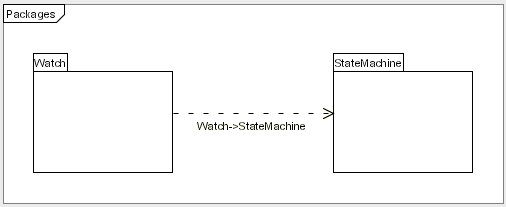
The Poseidon model includes two packages. The Watch package depends on the StateMachine package. The StateMachine package will be the same in any Xholon application that makes use of state machines, and should therefore be reusable.
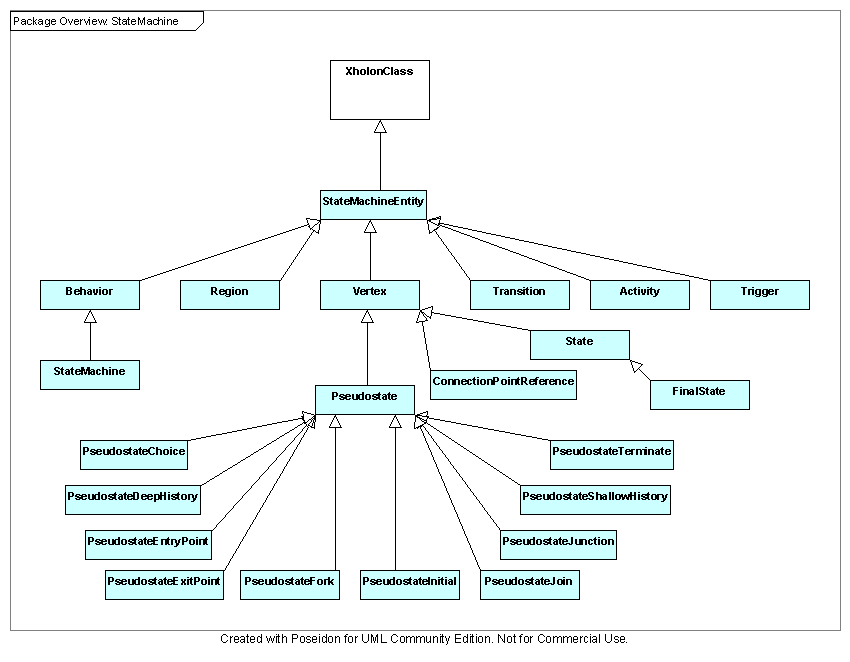
The following class diagram shows the Xholon classes and inheritance relationships in the StateMachine package.
The JTree viewer can show you each of the two state machines. The following diagram shows a portion of the ChronographControl hierarchical state machine. Compare this with the Poseidon state diagram earlier in this document, which shows the same information, and was used to generate the runtime structure you can now see with JTree.

Things to try
You can use the JTree viewer to follow transition chains. If you click on a state or transition, it will identify where the various connection points (cnpt) lead. A state or pseudostate should lead to a transition, and a transition should lead to a state.
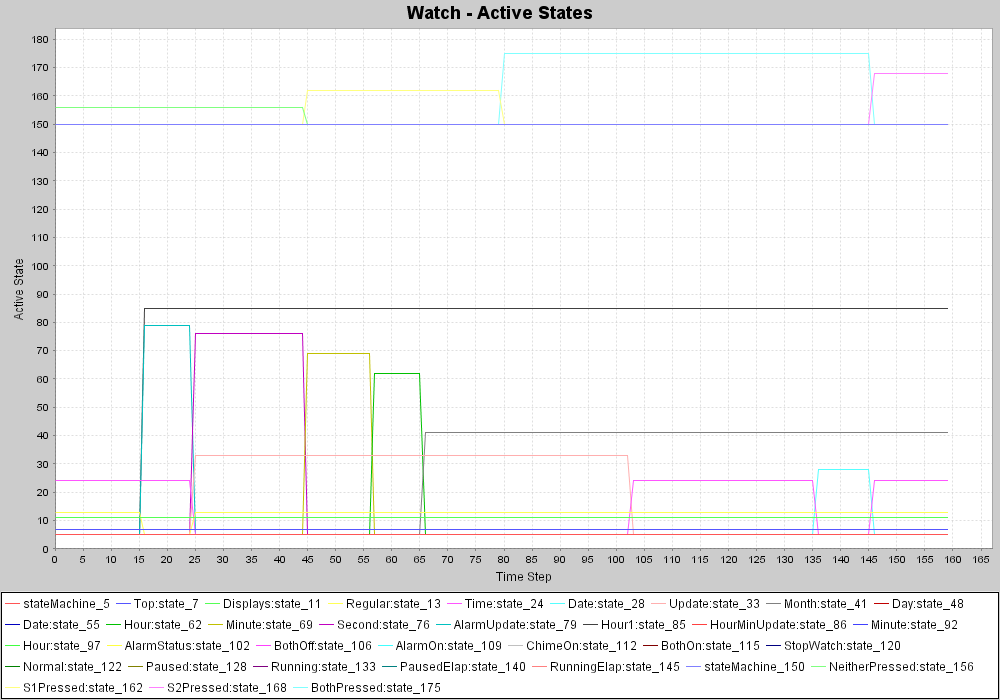
You can animate the changes in states by starting the "Active States" viewer. This is enabled by default, and will work if you have the optional JFreeChart software installed. Before pressing Start, or at anytime while the model is running, or when the simulation is complete, you can select View --> Watch - Active States to load the JFreeChart line chart. The names of all the states and state machines are shown at the bottom of the chart. As you push buttons on the watch, you will see the states changing on the chart. Each state has a unique ID, which can be determined from the Xholon GUI. While a state is active, a colored line will be drawn on the chart at the Y coordinate corresponding to its ID. In JFreeChart, if you position the cursor over one of the lines where it intersects with a timestep, it will tell you the name of the state, the time step, and the ID of that state. **Warning: JFreeChart gradually slows down because it redraws the entire chart each time step, so after some hundreds of time steps its performance will seriously degrade. To partly get around this, you can change the TimeStepInterval in Watch_Poseidon_xhn.xml to 200 or more, making it run slower and giving you more time to press buttons.
State machine animation can also be made to work using gnuplot instead of JFreeChart.
Extending the model
The model is incomplete. Implement additional watch functionality, such as a stop watch.
Xholon features
This sample demonstrates the following features of Xholon:
- nested composite structure including UML2 ports, parts, asynchronous messaging,
- a large UML2 hierarchical state machine,
- multiple state machines in the same application,
- state machine animation,
- ability to inject messages into a running application from the default JTree viewer,
- model-driven architecture (MDA) development using a third-party UML modeling tool and XSL transformations.
Credits and references
The idea for the digital watch sample comes from an example in Harel, D. (1987) Statecharts: a visual formalism for complex systems. Science of Computer Programming 8, 231-274. Harel originated the ideas behind UML state diagrams, and his paper is considered to be the seminal work describing these.