

Collisions - Sample Xholon App
What is it
This is a partial implementation of a statistical analysis described in a published research paper. The study involved a number of sets of data with various dependencies between the data sets. This Xholon example demonstrates that Xholon can naturally represent the type of data dependencies found in this type of statistical research. A dependency of one data set on another is implemented in Xholon as a port reference. The data sets themselves are individual xholons that are changed in some regular way over a series of time steps. Active objects make the changes on the passive data sets. The passage of time over a period of 25 years, causes events. Data sets can be active objects, passive objects, or both at the same time. An active object has one or more ports that allow it to access data in passive objects.
How to use it
Run it:
- Run the Java application (org.primordion.xholon.app.Xhn.java), and select File --> Open --> Collisions --> Collisions_xhn.xml.
- Expand the Controller node in the tree.
- Press the Start node.
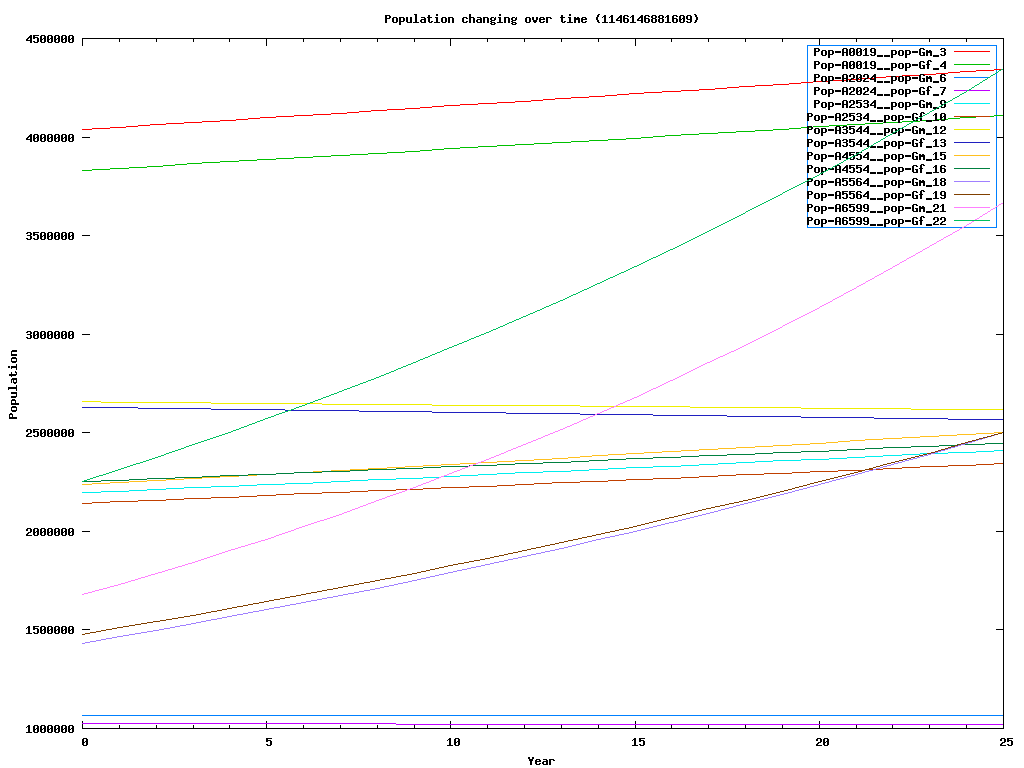
- You should see a line chart open up entitled "Population changing over time".
Things to notice
The chart shows changes in population between 2001 and 2026, for males (m) and females (f) in various age groups (0-19, 20-24, 25-34, 35-44, 45-54, 55-64, 65-99).
The chart can be drawn using JFreeChart (first chart below) or gnuplot (second chart below).

Expand the View node in the GUI. The various lower level nodes give the name of the chart, and the labels for the x and y axes. There is also one node for each data series on the chart. Each of these nodes has a port that references the node in the model that provides the charted data at each time step.
When you click on one of the model nodes that represents a data series, you will see the latest values of its variables displayed at the bottom of the GUI window. You can use the Step node to progress one time step (one year in this case) at a time. Click on Step, and then click on one or more model nodes to see how its variables have changed.
None of the ports are specified in ClassDetails.xml as is done in the other Xholon sample apps. Instead, they are explicitly established in XhCollisions.java in the configure() function using xpath expressions.
Things to try
The chart can also be drawn using gnuplot, or using any spreadsheet package that can read .csv files, including Microsoft Excel. A .csv file is just an ascii text file in which data values are separated using commas. In Collisions_xhn.xml change the UseDataPlotter parameter to gnuplot, and run the application again. A .csv file and a .plt file will be created in the statistics folder. gnuplot will be able to read the .plt file and produce a displayable .png file from the .csv file. For more information, see _README.txt in the Xholon statistics folder.
Extending the model
The model could be extended to include all results from the research paper.
Xholon features
This application shows how to chart results, and how to use xpath within a Xholon app.
CompositeStructureHierarchy.xml has good examples of how to initialize instance variables. Each instance of Pop-Gm and Pop-Gf has its own initial value for "val" and "rate". The various "Driver" nodes are given initial values for two other variables.
Credits and references
L’Écuyer, J-F, et al. Les effets des changements démographiques sur le nombre de collisions. Proc. CMRSC-XV; Fredericton, New Brunswick; June 5-8, 2005. http://www.carsp.ca/pub_05.htm